Chapter 11
Financial Statement Analysis
589
AP-20B (
4
7
)
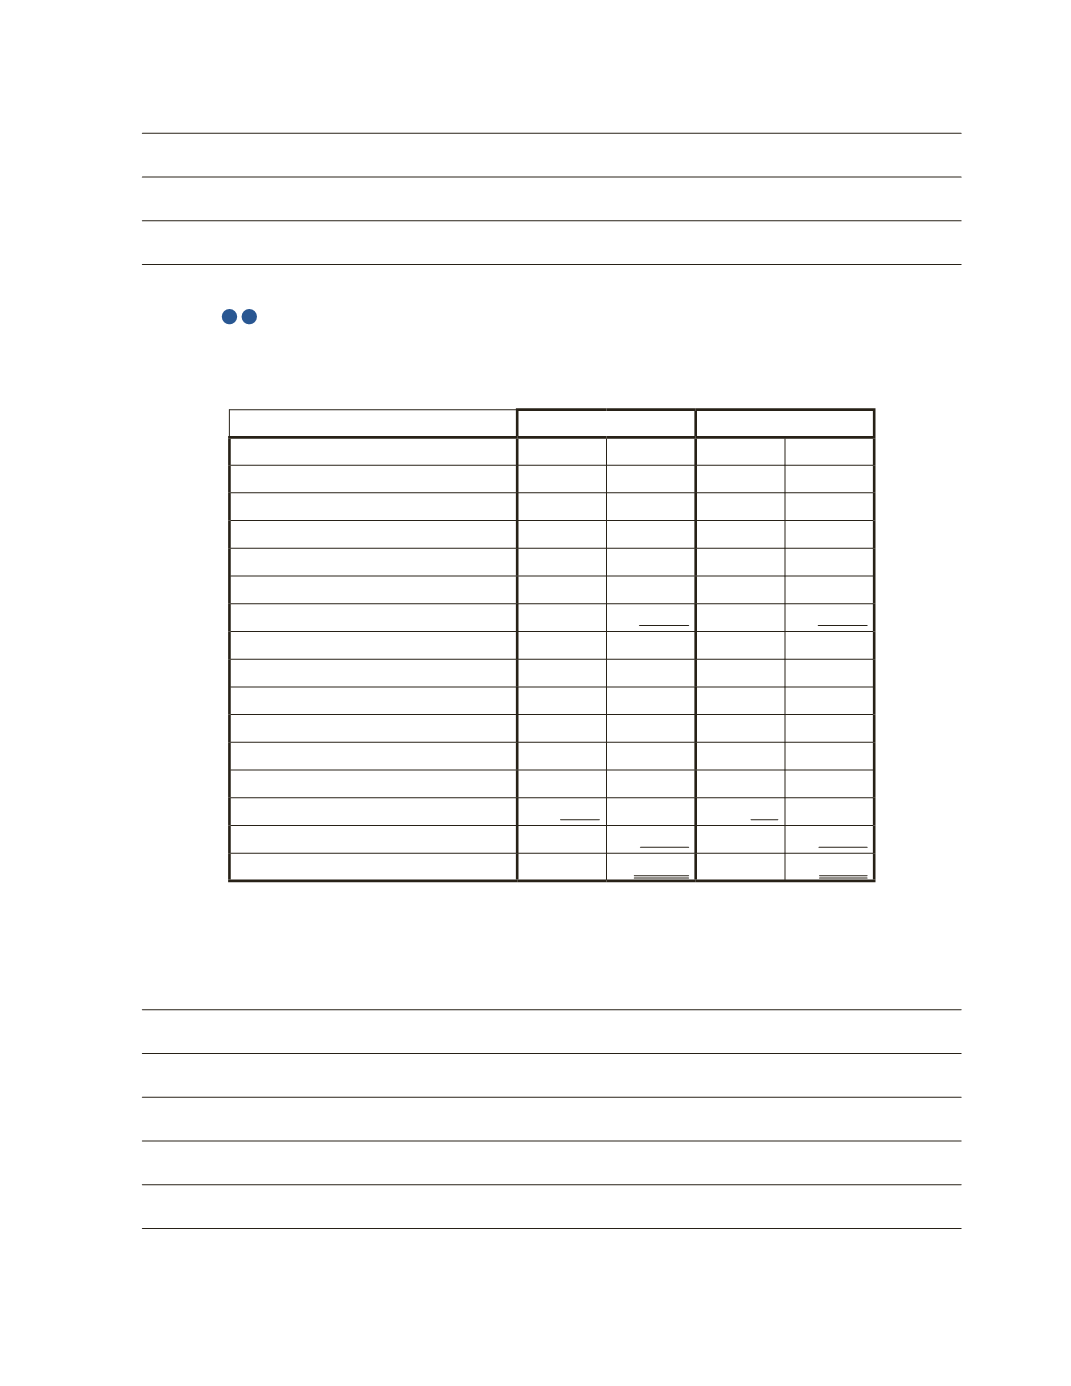
The financial information at December 31, 2016 for two similar companies is shown below.
Shaken Inc.
Stirred Inc.
Balance Sheet
Average Total Assets
$80,000
$50,000
Average Shareholders’ Equity
30,000
45,000
Income Statement
Sales
100,000
68,000
Cost of Goods Sold
40,000
34,000
Gross Profit
60,000
34,000
Operating Expenses
Advertising Expense
$20,000
$5,000
Salaries Expense
15,000
18,000
Rent Expense
10,000
-
Depreciation Expense
2,500
1,000
Interest Expense
1,500
500
Total Expenses
49,000
24,500
Net Income
$11,000
$9,500
Which company performed better during the year? Use relevant ratios to support your
answer.


