Chapter 11
Financial Statement Analysis
587
AP-18B (
2
)
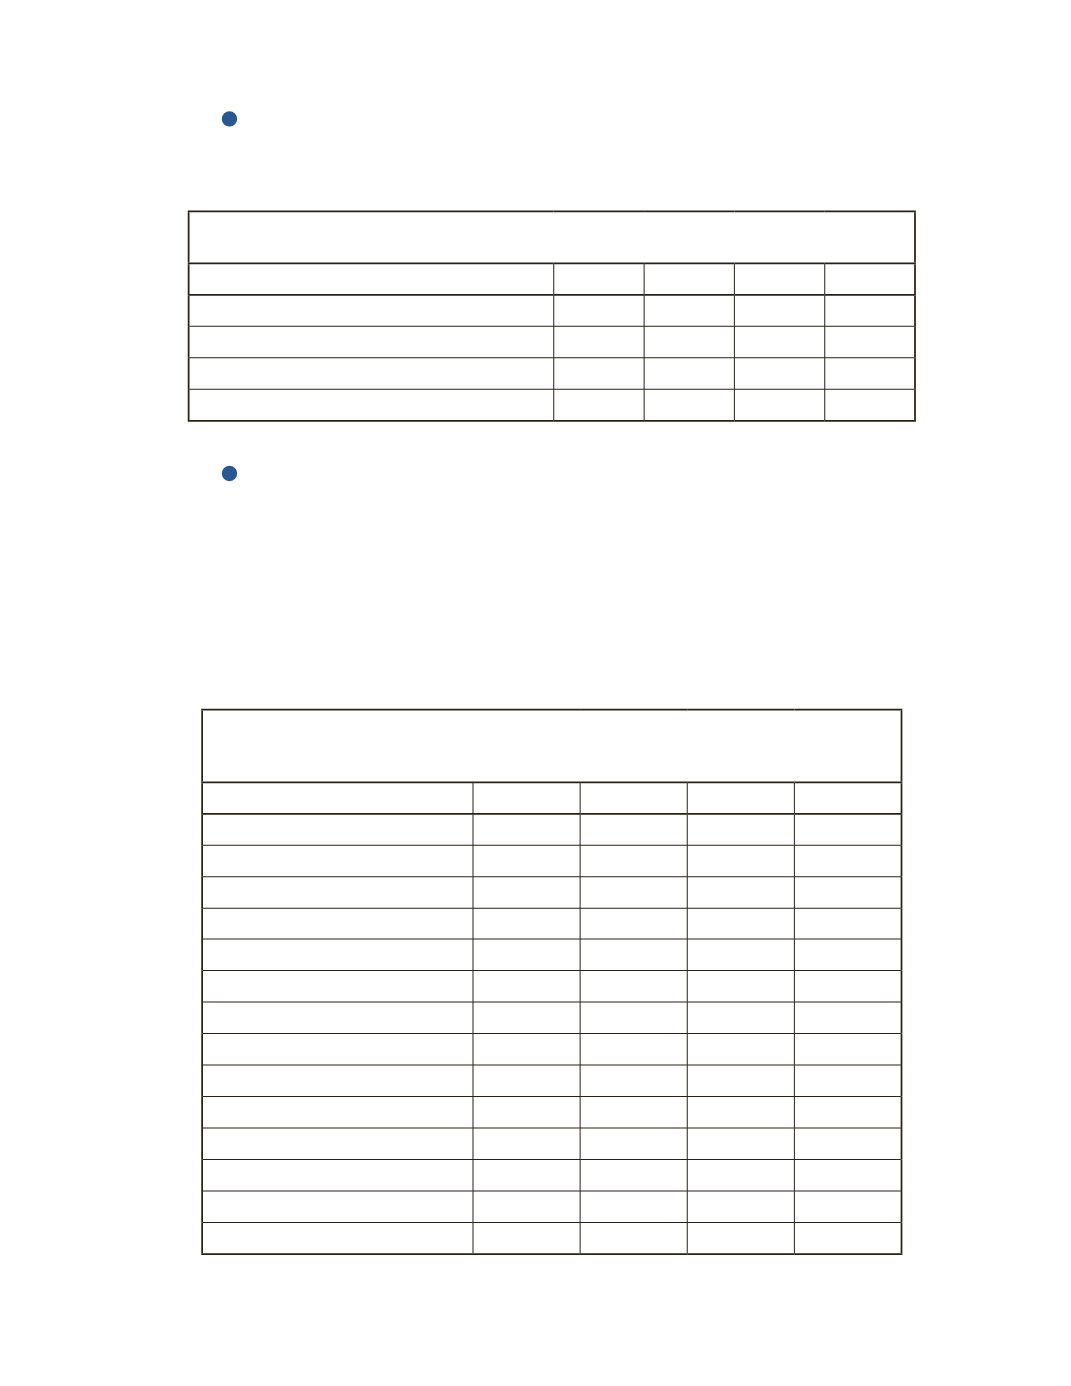
Perform a horizontal analysis for Mazzic Inc. Use 2013 as the base year.
Mazzic Inc.
In Millions of Dollars
2016
2015
2014
2013
Revenue
$469
$331
$292
$197
Revenue Percentage of 2013 Base-Year
Net Income
$258
$223
$178
$84
Net Income Percentage of 2013 Base-Year
AP-19B (
2
)
The following financial statements are taken from the records of Jade Inc.
Required
a) Use the horizontal analysis techniques to compare the changes between 2016 and 2015
balance sheet items.
Jade Inc.
Balance Sheet
As at October 31
2016
2015
$ Change % Change
Current Assets
Cash
$318,300 $319,400
Accounts Receivable
150,900
170,100
Inventory
381,200
414,800
Short‐Term Investments
116,500
104,700
Total Current Assets
966,900 1,009,000
Non‐Current Assets
527,850
318,900
Total Assets
$1,494,750 $1,327,900
Current Liabilities
$258,200 $224,600
Non‐Current Liabilities
126,900
109,500
Total Liabilities
385,100
334,100
Shareholders’Equity
1,109,650
993,800
Total Liabilities and Equity
$1,494,750 $1,327,900


