Chapter 11
Financial Statement Analysis
586
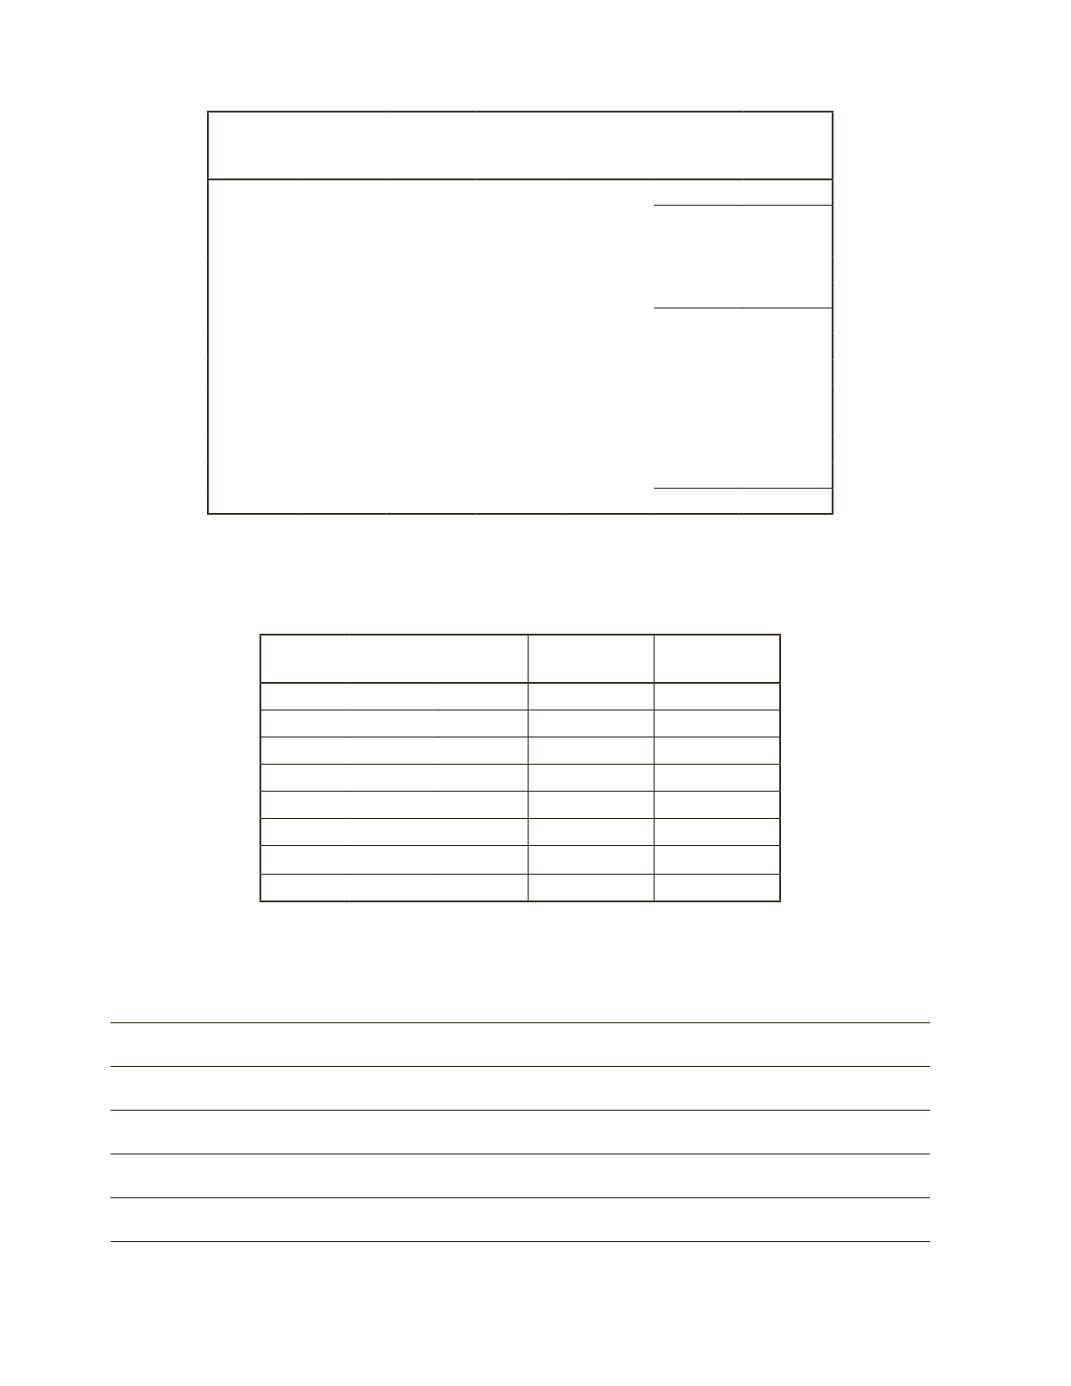
Midland Company
Balance Sheet
At the Year Ended
2016
2015
Cash
$76,540
$41,400
Accounts Receivable
37,000
44,400
Inventory
73,000
54,750
Equipment
110,000
158,000
Total Assets
$296,540 $298,550
Accounts Payable
$24,050
$28,860
Unearned Revenue
14,000
23,800
Long-Term Debt
60,000
60,000
Common Shares
50,000
50,000
Retained Earnings
148,490
135,890
Total Liabilities and Shareholders' Equity
$296,540 $298,550
Required
a) Calculate the following ratios for Midland Company for its 2016 fiscal year.
Industry
Average
Midland
Company
Gross Profit Margin
40.0%
Net Profit Margin
5.0%
Return on Equity (ROE)
8.0%
Return on Assets (ROA)
6.9%
Quick Ratio
1.2
Debt-to-Equity Ratio
0.75
Days-Sales-Outstanding
40.0
Inventory Turnover
6.1
b) Perform some ratio analysis to determine how Midland Company has performed in 2016
compared to the industry average.


