Chapter 11
Financial Statement Analysis
595
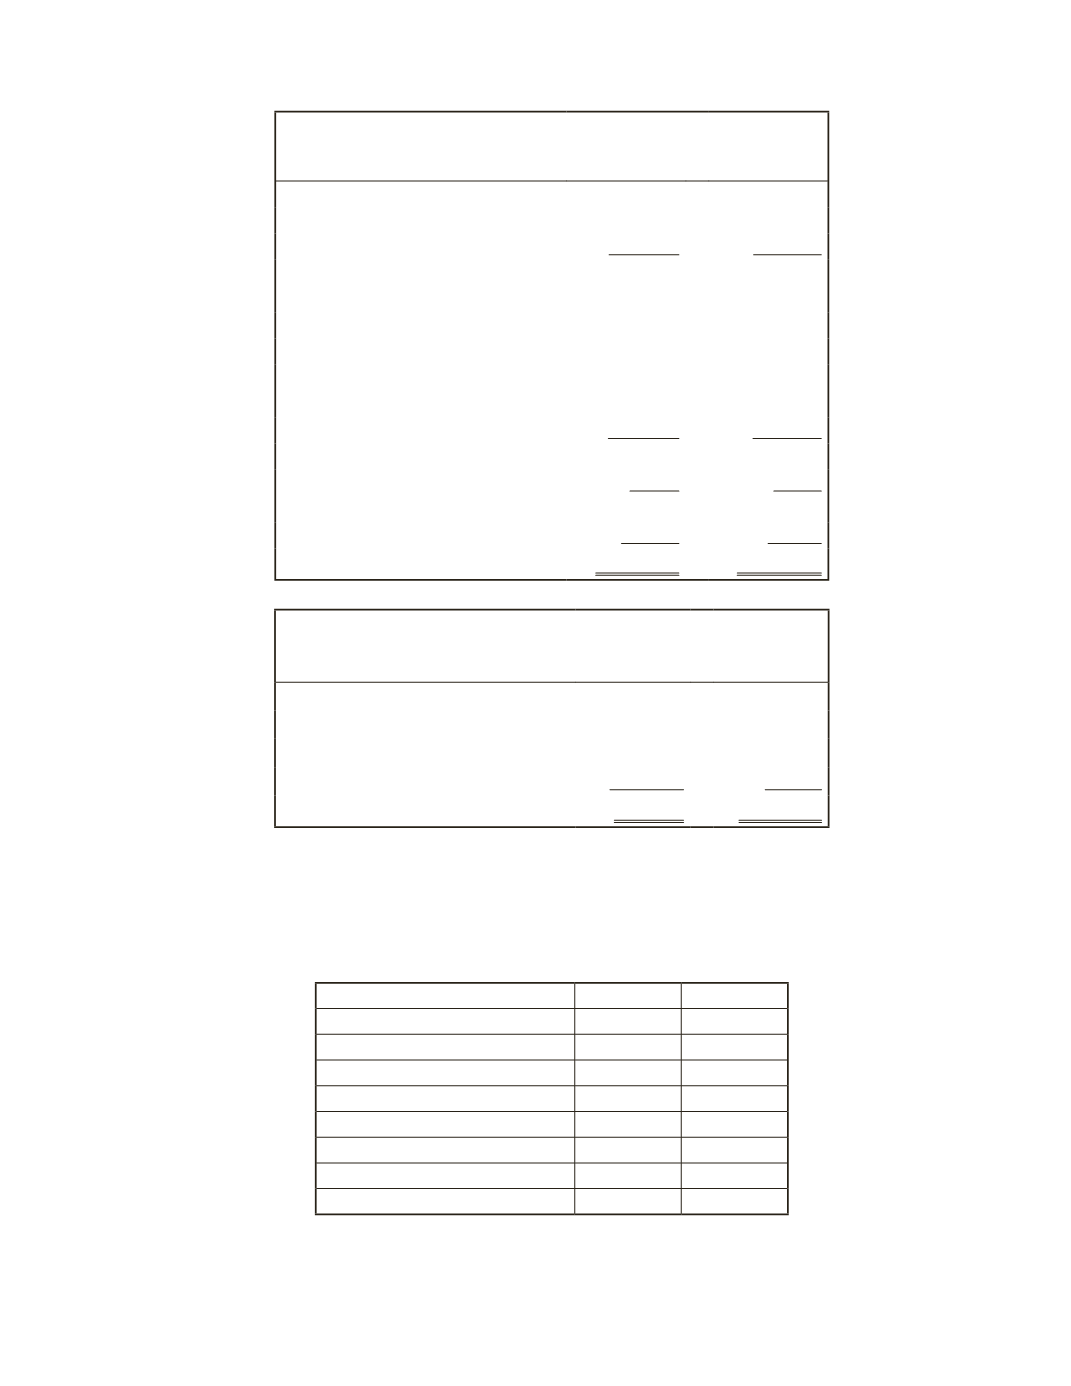
Research in Motion
Consolidated Income Statement (in thousands)
For the Year Ended February 29, 2016 and February 28, 2015
2016
2015
Revenue
$14,953,224
$11,065,186
Cost of Sales
8,368,958
5,967,888
Gross Profit
6,584,266
5,097,298
Operating expenses
Research and Development
964,841
684,702
Selling, Marketing and Admin
1,907,398
1,495,697
Amortization Expense
310,357
194,803
Litigation Expense
163,800
0
Total Expenses
3,346,396
2,375,202
Operating Income Before Tax
3,237,870
2,722,096
Investment Income
28,640
78,267
Income Before Income Tax
3,266,510
2,800,363
Income Tax Expense
809,366
907,747
Net Income
$2,457,144
$1,892,616
Research in Motion
Summary of the Cash Flow Statement (in thousands)
For the Year Ended February 29, 2016 and February 28, 2015
2016
2015
Net Cash Provided by Operations
$3,034,874
$1,451,845
Net Cash Used by Investing
($1,470,127)
($1,823,523)
Net Cash Used by Financing
($849,432)
$22,826
Net Increase (Decrease) in Cash
$715,315
($348,852)
Required
a) Calculate the following ratios for Research in Motion for 2016 and 2015. For any ratios that
require an average (i.e. ROE), use the closing balance for the year.
2016
2015
Gross Profit Margin
Net Profit Margin
Return on Equity
Return on Assets
Asset Turnover
Current Ratio
Quick Ratio
Debt-to-Equity Ratio


