Chapter 11
Financial Statement Analysis
567
AP-21A (
3
4
5
6
)
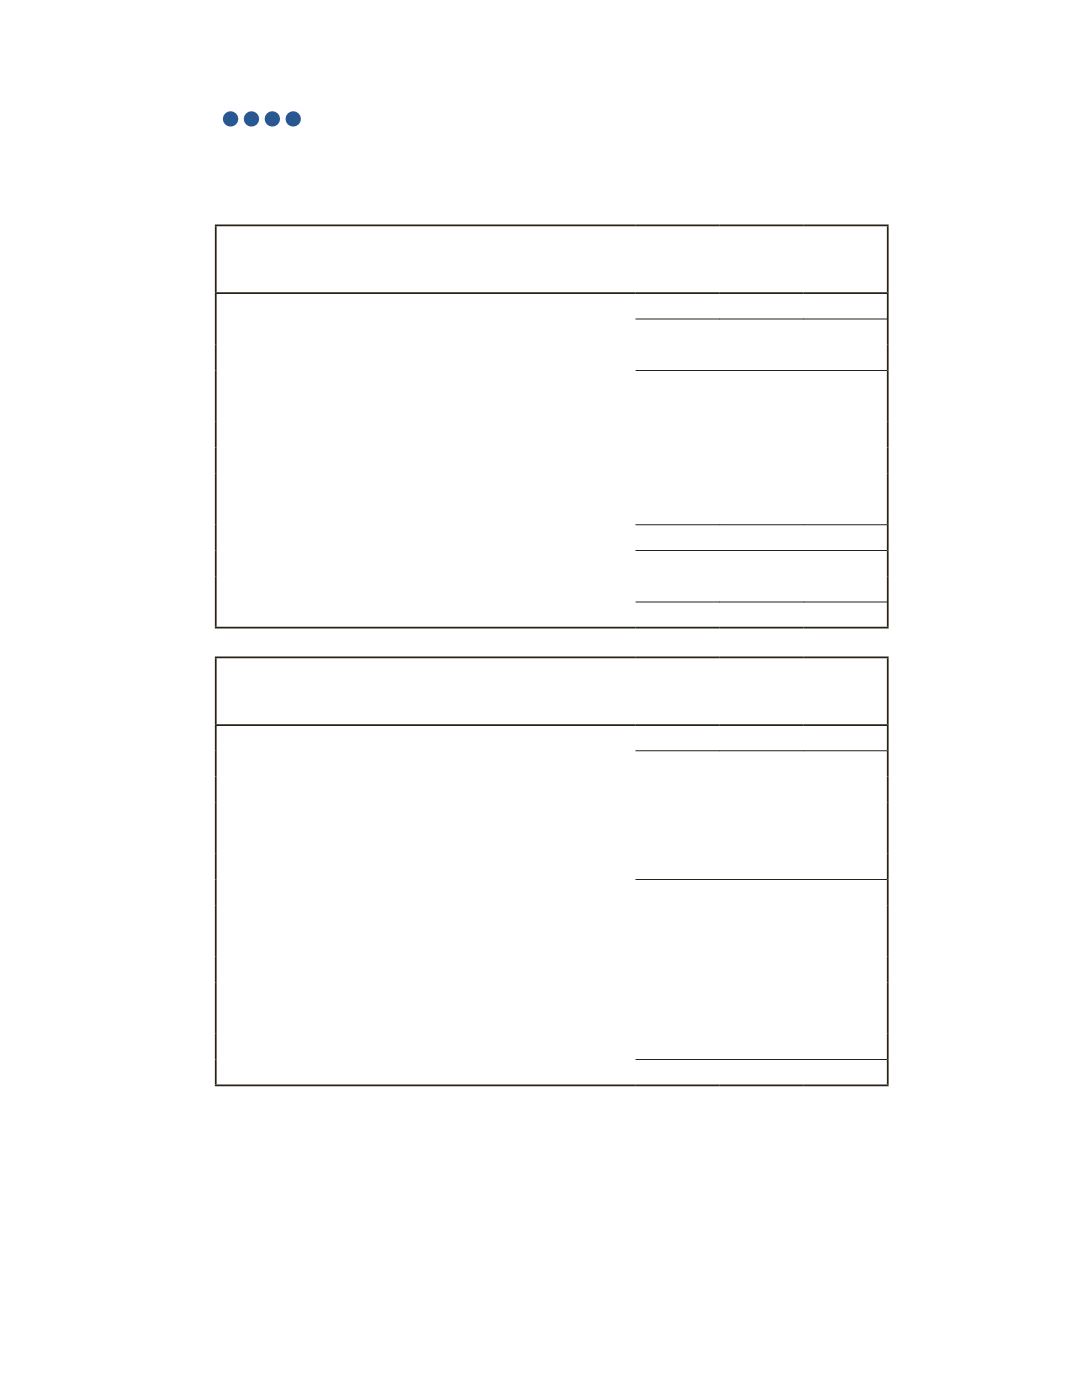
The income statements and balance sheets for Fallon Inc. are shown below for the last three
fiscal years.
Fallon Inc.
Income Statement
For the Year Ended
2016 2015 2014
Sales
360,000
324,000
342,000
Cost of Goods Sold
108,000
89,100
85,500
Gross Profit
252,000
234,900
256,500
Expenses
Operating Expense
54,000
48,600
51,300
Depreciation Expense
36,000
32,400
34,200
Advertising Expense
18,000
16,200
17,100
Interest Expense
6,800
7,650
8,500
Total Expenses
114,800
104,850
111,100
Net Income before Taxes
137,200
130,050
145,400
Income Tax Expense
72,000
64,800
68,400
Net Income
65,200
65,250
77,000
Fallon Inc.
Balance Sheet
At the Year Ended
2016 2015 2014
Cash
63,650
39,750
36,000
Short-Term Investments
11,000
10,000
8,000
Accounts Receivable
48,000
40,000
32,000
Inventory
18,000
22,500
27,000
Equipment
110,000
104,500
83,600
Total Assets
250,650 216,750 186,600
Accounts Payable
52,800
44,000
35,200
Current Portion of Long-Term Debt
8,500
8,500
8,500
Long-Term Debt
68,000
76,500
85,000
Common Shares
66,000
57,600 57,000
Retained Earnings
55,350
30,150
900
Total Liabilities and Shareholders' Equity
250,650 216,750 186,600
Other Information
1) Fallon Inc. has an unlimited number of shares authorized. The following number of
common shares were outstanding in each year for the entire year: 2016—50,000,
2015—48,000, 2014—47,000.
2) The following dividends were paid: $40,000 in 2016, $36,000 in 2015 and $38,000 in 2014.


